
This all started when I was interested in calculating the distance and bearing between amateur radio stations. I found this reference on calculating the great circle distance and bearing. Ultimately, this interest led to a web form for producing azimuthal maps.
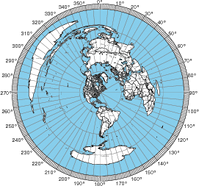
For those who never heard of an azimuthal map, it is a special kind of map that prioritizes correctly showing the great circle distance and bearing from the center reference point. Azimuthal maps are particularly useful for ham radio operators with a directional antenna. For example, if you’re in Connecticut and you want to talk with someone in Cameroon (Africa), the azimuthal map will tell you to point your antenna to a bearing of 90° on a compass (technically you also must adjust for the difference between magnetic north and true north).
It occurred to me that this the bearing and distance calculation was the fundamental tool for making an azimuthal projection. All I needed was a database of land and political boundaries expressed in latitude/longitude pairs.
The azimuthal project is always made from a particular reference point on the globe, and I can convert the points in the land and political boundary database into bearing and distance using the great circle calculations. This gives me a collection of points in polar coordinates (r, Θ) which is what I need for the azimuthal projection.
For the land and political boundary information, I used the database from the CIA World Databank II; however, it required some massaging. First it was too detailed, and I had to filter the data to an appropriate resolution. Next, I wanted land masses and water bodies to be represented by closed paths. The CIA World Databank II is a collection of unconnected paths, so I had to write a program to patch them together and reorder the points to be clockwise. Having closed paths of points ordered in clockwise orders is necessary to have water and land colored differently. Lastly, I had to identify which closed paths represent land and which represent water. Unfortunately, this work is incomplete. You’ll notice some lakes that aren’t colored blue.
Initially, my Ruby program was generating raw PostScript. However, I recognized that it would be easier for people to use if it generated a PDF. Rather than using a Postscript to PDF convertor, I changed to generating PDFs directly using the Ruby PDF::Writer. By using PostScript or PDF, I get vector graphic output that is scalable from small to very large sizes without having to make a huge raster graphic files. There is a limit to the resolution of the continent & political outline data, so at very large sizes, the outlines may not appear smooth.
Ultimately, I used the great circle distance formula from Wikipedia. According the article, it’s accurate for both long and short distances.
The hardest part of the whole project was getting the water blue. There are still some maps where the program gets it wrong, and you’ll see weird coloring. Things tend to go wrong when the reference point is inside a particular small region of land or water. In these cases, the floating point accuracy seems to cause the colors approach to fail.
My plans for future improvements include:
- add small tables of bearing & distance for important world cities around the margins
- add US and world cities to the map (particularly for area map)
- adjusting political boundaries and labels to be more accurate
- adding more views to allow people to report lakes that aren’t colored correctly
Thanks so much for maintaining this map generator. I just made a set of maps with different distances for my shak. I tried to follow the link to make a donation and found the link was down.
I know these downloads cost you a bit and I’d like to help. Send me some information and I will try again.
I got a defective map from a particular location. The center location is 1°21’33″N 103°59’22″E (Singapore Changi Airport. If the distance is set from 15000 km to 19000 km (approximate), none of the continental borders for Africa, Asia, or Europe are drawn; although the national borders are. If the blue background is turned on, the coloring is defective where most of the oceans are still white but the Americas are blue as if they were an ocean. Outside of these distances, the map rendering appears normal.
I would also like to know if there are a future plans to add a setting to adjust the spacing between the “range circles”. Currently the circles are always set at 1/4 distance, e.g. for 20000 km, these are at 5000, 10000, and 15000.
By the way, I have found this tool to be quite useful even though I’m not a ham radio operator. I use it mostly for air travel to determine great circle routes between airports on international routes. [You might have deduced this from the above. I normally set distance to 16000 km as this is roughly the current longest distance of a regularly scheduled flight, which is how I discovered the issue mentioned above.] However the first time I used it was when someone asked what amounted to a trivia question about what the nearest foreign location/border was to a particular US city.
I do not recommend my map for safety critical activities like planning air travel.
Thanks for this wonderfully useful tool. To clarify, are the bearings Magnetic for my location or are they True?
I don’t understand why I have to enter my credit card no. for a free service.
Nothing on my webserver prompts for a credit card.
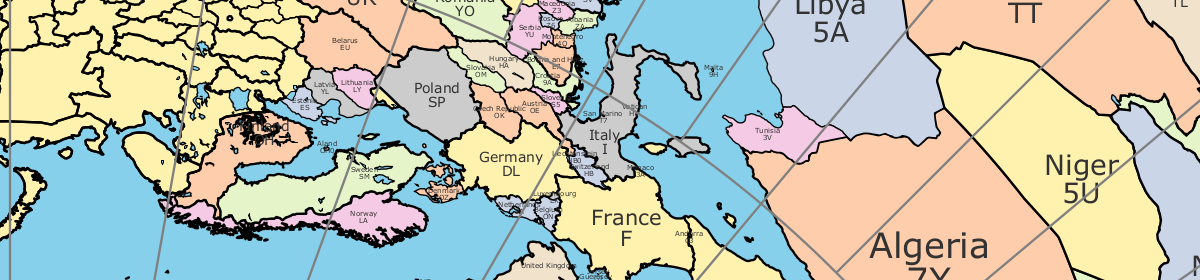
Great program! Thank you! Wondering if you might have any plans to add color to countries? Thank you!
Yes. See experimental site here: https://ns6t.net/AzShadowMap/experimental.html
I like experimental but haven’t played with it a lot yet. Since I have remote stations all over print some for various locations like I do with your original maps.
Don’t suppose you will be at SeaPac convention Oceanside OR End of May. You could make a good presenter some year. Hopefully won’t rain again this year for the ocean side events.
Dave in Phoenix WØJKT “Just Killing Time”
Sorry, I’m not planning to attend SeaPac.
Good afternoon
the map generator is not working please advise and thanks for such a great service
How is it not working.
Coming back to this hobby. Just got General Class and setting up new shack. Have end fed with long axis at 136 deg. This map shows me what to expect with respect to my antenna radiation.
BTW, love the experimental and its zoom capabilities. Thank you.
Do you have some “goodies” for calculating azimuth and distance?
Absolutely brilliant!
I’m a new ham and found this so useful. Although I don’t own a beam, I found it really useful for orientating my wire antenna. It is probably the best online resource I have found. Thank you!
Great application! Just love the experimental teaser as I wanted a version with country colours and prefixes. Prompt response, I must confess!
I have been looking for a while for an azimuthal map that I can customise.
Thank you for the service you provide.
Thanks so much for maintaining this map generator.
Very Handy and Helpful.
73′
Have you considered a toggle for azimuth values in magnetic vs grid ? Would be valuable and not too hard to derive I think. Thank you great tool.
I don’t think it’s that’s simple. If someone wants to add that feature, I can introduce them to the code and facilitate it.
https://sos.noaa.gov/catalog/datasets/earths-magnetic-declination/
Hello. Just learning, just got my license (KE8YZY). I enterned 44.7629° N, 85.6210° W and the map generated locates center in Northern China. Any ideas? Thanks.
I tried your coordinates without the degree symbols, and it worked for me.
Hello! that’s a great tool ! Big thanks!
I’ve a question probably not relevant as per poor knowledge from my side.
I didn’t find an exact match when one reverse the path:
ex:
location Rome (IT) =>> Broome (Australia) will be at roughly 95 SP/275 LP on the map.
Now reverse:
Location Broome (AUS) =>>Rome (IT) will be at roughly 310SP/130LP
As you can see, there is a 35degres discrepancy between the two maps : is there a technical explanation to that ?
By the way, many thanks for you time spent to build and maintain this incredibly useful tool.
all the best,
Frank
I think it comes down to straight paths on spheres behave differently that straight paths on planes.
Is there is way to enter all the information to generate a map directly into the URL line itself?
Something along the lines of
https://ns6t.net/azimuth/code/azimuth.fcgi?location=CM87&paper=LETTER&title=Titleis there a way to generate a map directly from the URL (i.e. embedding the lat, long, etc directly into the URL)?
Something along the lines of
https://ns6t.net/azimuth/code/azimuth.fcgi?location=CM87&paper=LETTER&title=Title6/21/2025 6:17 PST
Internal Server Error
The server encountered an internal error or misconfiguration and was unable to complete your request.
Please contact the server administrator at webmaster@localhost to inform them of the time this error occurred, and the actions you performed just before this error.
More information about this error may be available in the server error log.
Apache/2.4.62 (Debian) Server at ns6t.net Port 443
Hello, very nice tool
Do you mind sharing the code? Preferably on the github 🙂 I would like to take it and add more country prefixes, implement some of the features you have in mind, etc.
Thank you
73 Sam OM2ADX
You mean like this, https://github.com/tepperly/Azimuthal; although, there are some binary files that aren’t part of the repo that I would need to send you.
Can you please add a feature that removes the gray lines around the map? I want a visual map that doesn’t have the gray lines and it’s impossible to remove them via Photoshop or Canva.
If you’re asking about removing the graying that shows what part of the world is in shadow from the sun and what part is currently illuminated, this is already implemented. Go to the “General Settings” tab and unselect “Animate Grayline:”. If that isn’t what you’re looking for, try deselecting “Degree Marks:” or “Map Grid:” to see if either of those does what you’re hoping for.
Thanks for the map; went sailing in search of new continents, I got in trouble finding where to steer my ship from here in the middle of the ocean 🙂
Just experimenting with my LoRa TinyGS setup, ended up here traversing the web in search of antenna related stuff.
I don’t recommend using maps generated by my site for safety critical things like piloting a ship or aircraft.
I am getting a error when the map is being generated. I entered coordinates of 34 21 33N, 86 18 03W. When the map prints it comes out with coordinates of 81 18 2W.
Try 34.3367565,-86.4711767 instead.
WOW!!! I’m what is commonly referred to as “user stupid” when it comes to using anything computer based but I downloaded this map with no problem at all! This is super nice and will be extremely useful for HF commo. How do I donate to your effort?
Sorry. I hit the wrong key on my phone for my callsign. KQ4AVW Tommy.
Hey i want to report a bug!
Yugoslavia does not exist and yet the map generates it for some reason.
The database of political boundaries is very old particularly for the black and white map. The experimental new map has a newer database of political boundaries.
Hello, I tried several parameters coincident with the following error message and the results remain the same. The map fails to generate and the error message in the resultant file remains as follows:
“The data in the form contained errors in the following fields:
[“PAPER\nPaper argument is wrong ”\n”, “TITLE\nTitle has illegal characters.\n”]
Please try again.”
I greatly appreciate you’re providing this mapping tool. I use it a lot and I am in awe of folks who can create programs like this. Many thanks. Andy W4JVI
Tom, how would I obtain permission to use five azimuth maps to help with an explanantory depiction in a book I am authoring? The source would be credited, and of course it would be made clear that the opinions in my book were not necessarily shared by the mapping source… ns6t.net
There are problems on the borders of the states in the generated maps
This database of political borders used here is better than the first site. Otherwise, I need more information to help.
to use this map with PWRC I’m not sure where to save created map “Azimuthal.jpg”
Thanks
Jim KB3CJU
I don’t have any experience with PWRC rotators, so I suggest contacting a source connected with PWRC.
now that I have created the map I don’t understand how I can plug it into the PWRC antenna rotator
I don’t know about PWRC rotators, so I don’t know how to help.
Having Trouble figuring out how to plug this map into PWRC rotator
Coordinates above 70N results in map distortion and 90N is in the wrong location. Otherwise, it’s working normally.
btw, thank you for this great tool,
Danny W
I am not sure how to debug the issues you’re having without more details. To some extent, the whole concept of a azimuthal map falls apart when centered at 90N. From the north pole, every direction you look should have a bearing of 180° (i.e., south). Similarly from the south pole, every direction you look should have a bearing of 0° (i.e., north).