
This all started when I was interested in calculating the distance and bearing between amateur radio stations. I found this reference on calculating the great circle distance and bearing. Ultimately, this interest led to a web form for producing azimuthal maps.
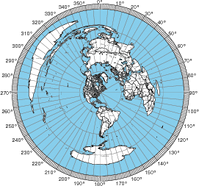
For those who never heard of an azimuthal map, it is a special kind of map that prioritizes correctly showing the great circle distance and bearing from the center reference point. Azimuthal maps are particularly useful for ham radio operators with a directional antenna. For example, if you’re in Connecticut and you want to talk with someone in Cameroon (Africa), the azimuthal map will tell you to point your antenna to a bearing of 90° on a compass (technically you also must adjust for the difference between magnetic north and true north).
It occurred to me that this the bearing and distance calculation was the fundamental tool for making an azimuthal projection. All I needed was a database of land and political boundaries expressed in latitude/longitude pairs.
The azimuthal project is always made from a particular reference point on the globe, and I can convert the points in the land and political boundary database into bearing and distance using the great circle calculations. This gives me a collection of points in polar coordinates (r, Θ) which is what I need for the azimuthal projection.
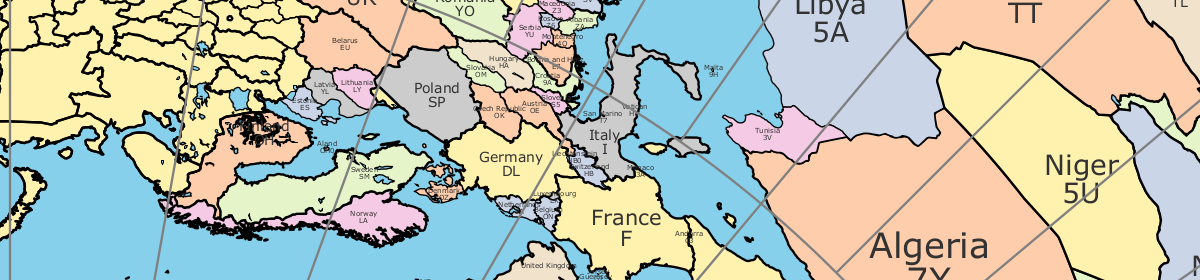
For the land and political boundary information, I used the database from the CIA World Databank II; however, it required some massaging. First it was too detailed, and I had to filter the data to an appropriate resolution. Next, I wanted land masses and water bodies to be represented by closed paths. The CIA World Databank II is a collection of unconnected paths, so I had to write a program to patch them together and reorder the points to be clockwise. Having closed paths of points ordered in clockwise orders is necessary to have water and land colored differently. Lastly, I had to identify which closed paths represent land and which represent water. Unfortunately, this work is incomplete. You’ll notice some lakes that aren’t colored blue.
Initially, my Ruby program was generating raw PostScript. However, I recognized that it would be easier for people to use if it generated a PDF. Rather than using a Postscript to PDF convertor, I changed to generating PDFs directly using the Ruby PDF::Writer. By using PostScript or PDF, I get vector graphic output that is scalable from small to very large sizes without having to make a huge raster graphic files. There is a limit to the resolution of the continent & political outline data, so at very large sizes, the outlines may not appear smooth.
Ultimately, I used the great circle distance formula from Wikipedia. According the article, it’s accurate for both long and short distances.
The hardest part of the whole project was getting the water blue. There are still some maps where the program gets it wrong, and you’ll see weird coloring. Things tend to go wrong when the reference point is inside a particular small region of land or water. In these cases, the floating point accuracy seems to cause the colors approach to fail.
My plans for future improvements include:
- add small tables of bearing & distance for important world cities around the margins
- add US and world cities to the map (particularly for area map)
- adjusting political boundaries and labels to be more accurate
- adding more views to allow people to report lakes that aren’t colored correctly
I would like to print a few distances for my HF station and VHF go kit for ARES so I have a feel for “range” on 75, 40, and 2M. Got charts displayed on the screen which will be helpful but I could not get them to print.
There is an option on the web form “View in browser”. Try deselecting that option.
73 de NS6T
I am having issues on my android phone with a paper size argument. I have office suite and adobe. No setting I choose seems to work….can anyone help me out please
I generated an azimuthal plot and tried to print it but it locked up my printer. Don’t have a clue why.
N7RT
What type of printer and system queuing to it? You might try playing with the printer settings in your PDF viewer.
Tried to print but it locked up my printer.
I love this program and would like to use it for teaching celestial navigation. Is there is any way to make these changes, it would definitely increase its utility:
1. Not plot the azimuth rays from the map’s center, but keep the degree markings and labels on the perimeter.
2. Not plot the distance from the circles at all center circles at all.
2. Plot longitude meridians at 5 degree intervals rather than 20 degree intervals.
3. Plot latitudes at 5 degree intervals rather than 10 degree intervals.
5. Be able to shut off the country outlines when necessary (navigators have a need for the coordinator systems only).
Congratulations! Exellent instant ready and sharp like what! Will try to get a BIG map to glue it on my wall.
Will be a fine decoration and useful to point my antenna 😉
You can be proud!
And me satisfied.
Fall greetings from Finland EU
Seppo (80) and Tuula OH2NZA
Was so happy that remembered not tell my gears –
Novells OpenSuse, 2 x 64 and printers HPLaserJet 1200 😀 plus HP Photosmart wireless – use naturally other printing layouts for big printings…
Linux and printers working without any problems already for 4 Years. Automatic updates and I can only use them.
Hello Tom,
Thank you for your efforts to make this publicly available!
I have a suggestion:
– an option to label (and draw) sub grids, i.e. when ‘label grids’ is ‘on’, one level
deeper, and optionally label the sub grids and their boundaries from 00 – 99.
Useful for VHF/UHF/SHF-operators and ‘square hunters’ to colour their worked squares.
– if the above can be realised, optionally remove the tapered compass rose inside the
the as the azimuth is (already) displayed at the circumference.
Kind regards,
Remco
Fantastic program ! Thanks for all your work.
Regards
Wessie ZS1VV / ZS2A
Dear Tom,
No words are enought to thank you for such an amazing work you have done to get this Az map. I have just created one for the location I live now, near Lolol ( Chile ) , and beleive me when I say I will use it !!!
I made one , 25 years ago , centered in Stgo Chile , but no computer at that time, I drawed it completely by hand , and used self sticking letters for all the prefixes known then !! With the help of a couple of friends we made it print 1000 copies, and spread it among hams in Chile ……You can easely imagine I had the fun of my life. But I have seen that amateur friends still keep it in hanging on their walls HI !
That’s recomforting .
Thank you very much again !!!
Michel – now XQ 3 DPD/4 –
I am a first time user and found this to be a terrific program and very easy to use. Thanks for making this available.
— Harlan, K6BS —
Merci Monsieur pour votre programme !
Merry Christmas and Happy New Year .
73s
Eric
ICA01
Excellent website, straight-forward. The possibility to enter the input in various formats without having to fiddle around adds to its excellence. Congratulations, and thanks, Tom
De Mike k9mw
Hi Tom,
I want to report a bug.
(For the rest your maps are fabulous, you really have made something unique and of very high quality!!!)
If I create an azimuthal map of Europe (center JO33he, distance 2000 km), the program makes a mistake in land and water. the continent shows up blue, the Atlantic Ocean as white, and England (which is an island) is also white.
This problem is not present in maps with the same center and a radius of either 1000 or 300 km.
Yes, I’ve seen this bug before. Unfortunately, my program uses a heuristic to determine what the inside of the curve is, and in some cases, it doesn’t get the right answer. I’ve had some ideas on how to improve it, but I’ve had no time to implement them.
Tom
Hi Tom,
I am very impressed with the quality of your maps!
For a demo of WSPR at my work, I have just created a MatLab program to get WSPR spots of our 100mW beacon out of the WSPR-net database and plot them on an NS6T azimuthal map. On the firsts few tests the beacon has already been heard in the USA (7000 km) ! I’m sorry that I cannot post any pictures here. Can I mail them to you?
When we get more distant spots, I switch to a map with greater maximum distance. For that purpose I downloaded and save a couple of maps with different distances first. Seeing the spots on an azimuthal map is great, much beather than the Carthesian map on WSPRnet!
As soon as the software is stable (almost, doing some cosmetic things today) I will share it on MatLabCentral as open source and send you a link and some examples too.
As we have a demo to give, I focused on a solution for our location only, so another user will need to download his own maps first. If I have some time later, I will try if I can get that done automatically for any user QTH. I cannot read PDF maps with MatLab, JPG, EMF and the like are not a problem. so have to find out how to solve that problem.
When this works in MatLab, maybe I can someone else can translate the idea in a more common language or make a webpage for it… Later 🙂
Kindest regards, 73,
Ben
First of all, sorry that there is a delay between when you post a comment and when it appears. I get around a thousand WordPress comment spams per week even with the reCATCHA plugin, and it takes a while to filter through them and find actual comments.
I would be happy to see your WSPR-net maps, and I could post them here. I’ve thought about adding a feature to allow people to upload a KML file that would add items to an azimuthal map.
There are tools that can convert PDF to a bitmap graphic format.
Thanks,
Tom
NS6T
Thanks Tom, that was just what I was looking for… EXCELLENT.
De VK5ML
Hi Tom, your world maps a great! You made a nice job.
I found a minor problem by enter my location JO41js and a distance of 3000, paper size A4. There comes a nice map of europe – but there is no England, no Ireland and no Islands at all. I can see the names of the british cities but no country border. The bug is witth distances between 2000 and 3000. at 1500 or less and 3500 or more it works fine so donot worry.
vy 73 de Hermann
Thanks for the compliment. I tried reproducing the bug, and it doesn’t happen for me. I’ll try following up by email.
73 de NS6T
worked very well Thanks
Hi Tom, it is the great tool!
One suggestion: It will be a great to have an option for projection of polar zones on the map.
What do you think?
Mikhail
Hello !
Tanks for the very good programm !
Merci pour ce programme très pratique pour les radio-amateurs, mais aussi pour les sismologues amateurs !
Félicitations, Merci Jean-Pierre
Hi Tom,
Great tool, started using a Hexbeam and this helps a lot.
73’s de Ivo SQ5BIH at KO02JH
Complimenti ottima idea e programma,forse sarebbe ancora più gradevole dare un poco di colore magari per Zone 1 – 2 – 3 .
Cordiali saluti
Great program, worked fine first try. Would be nice to optionally number the lat lon grid lines. To locate a boat at sea I only have their lat lon and have to count from zero to get their location and antenna heading. Would save manually labeling them.
Thanks a lot for a great program Frank N1HNN
Thanks for writing this program and for making it available on line.
Suggestion: I would like to be able to select landscape mode and offset the map’s centre point so I can make better use of the available paper.
I’m in Seattle, so the best use of a letter-sized copy of a map covering just the continental USA would be landscape mode with Seattle moved most of the way to the left and up a little.
Currently with a scale that includes all of the lower 48 states (radius about 4600 km) and printing in portrait mode, only a small fraction of the printed page contains useful information.
Possible problem: When viewed in Firefox v22 the program reacts inelegantly when using Ctrl + and Ctrl – to scale the display.
Grumble: I *REALLY* dislike Captcha, use of which is required to leave a comment. There must be a better way!
Rob AE7EG / G3WKH
Thanks for the suggestions and sorry for the captcha.
I am having some trouble seeing how landscape would make things better unless the visible part is allowed to be bigger than the circle it’s currently limited to. Changing the visible area from a circle to something else is a significant complication. I don’t see that kind of change happening anytime soon.
73 de Tom NS6T
I saw the opportunity to download the Azimuthal Projection (not sure what was included) and a virus warning popped up. I hate viruses. Hard to get rid of sometimes. BTW, I just discovered your site. Lots of information for which you are to be thanked by everyone. I’m sorry I can’t contribute as I’m retired and the old savings account is on a downward spiral. There was once a time where it would climb, slowly but never the less upward. Now it is (has been) steady down hill. Almost time to start cutting back on sodas, dessert, driving to the mall once a week – now once a month, waiting or manyana (putting it off). Oh well at least I can listen to the radio for enjoyment. Thank you for your services.
Nobody is obliged to contribute. Make maps with a clear conscience.
Excellent service, thanks for sharing.
Hi. Great site. Question about the ADIF map. How can I center it on my qth? or at least on the equator south of my QTH? I’m in HI.
Thanks. And again – great site.
73/Tom
For the QTH map, I don’t really have a way to center it on your QTH. I put the QSO dots on a static map made by NASA. Are you looking to put your QSO’s on a azimuthal map?
Great site. Thanks for making it available. I will post a link in the forum of my website.
It would be nice to be able to give a different colour to each country.
73, Al
Thanks for the suggestion. I’ve recently gotten permission to use another database of geographical boundaries. The new database might allow me to give countries different colors. My current database doesn’t have separate outlines for each country.
The map is a great asset.
But is there a trick to printing at higher dpi resolution? On my laser printer (600 dpi), the “Azimuthal Map” etc. caption prints out at high resolution but the map per se including the degree calibration seem low resolution, perhaps 100 dpi.
Good afternoon, can’t make a map on the website, tell me where you can make a map? the site will work?
My web hosting provider upgraded Ruby, and that broke my azimuthal map generator. I’ve got it running again (although not completely debugged). Start by entering information on this page.
Hi – Any feedback on the prior printing questions? I can’t get it to print at al – I just get a blank page. TNX, Paul
I’ll need more details about your situation to help. I’ll ask via email. 73 de NS6T
Thanks to Tom for following up. I was trying to print a PDF from the web-based display page. I unchecked ‘View in Browser’ and it downloaded a PDF copy straightaway. FYI, I picked 19,000km for my range and got a good picture of the whole world.
Thanks again for a great website!
Paul
Hi,
would you consider adding amateur radio prefixes instead of country names?:)
What I also see is that circle bearing degreess does not fit into page (I was testing this on on A0 and 4A0)
—
Dawid
Yes, A0 and 4A0 have problems that I need to fix.
I’ve wanted to add callsign prefixes, but I haven’t been able to find a good database of prefixes and latitude/longitude coordinates where they should be put on a map.
Tom
NS6T
I was unable to generate any maps bigger than 8.5X11. Wanted to be able to create some at an ANSI size C. Got everthing I needed in 8.5×11 but assumed tehy would pixelate if I tried to print them larger
Thanks
Bruce
What a cool service you provide, thanks! Do you go to Dayton? If so, I’ll buy you a beer or three.
73,
Mike W3MC
W3MC TNX. Maybe someday I’ll go to Dayton.
73 de Tom
Tom,
regarding PREFIX +ccordinates list, have you tried:
http://www.country-files.com/cty/country.dat
If possible please contact me by email, I’d like to help you to improve this tool with prefixes…
—
Dawid
I’ve tried this a little, but the results weren’t good enough. I emailed you.
Thank you!!! Got a great card!Add prefixes will be great!!!
Nice program however I was unable to get a map when selecting tabloid (11X17) as the size. It goes through the motions, but there is no image.
There was an error with tabloid, ANSI B, ANSI C, ANSI D, and ANSI E. I believe it’s fixed now. Thank you so much for reporting this issue.
awesome!
Hi! I’m getting server errors when I try to run this. Looks like a great site.
Love your site! I’d like to be able to print a more details map of a much smaller area.
Unfortunately, the databases I have access to only have a limited amount of data.
Super polar map generator. Thank you
My suggestion is to add a circular 200 km/mile range circles.
Great web site, and one of the best Great Circle Map generators out there. Simple, elegant, it just works! Thanks for making it available to all.
Another comment. Thanks for creating the maps in high resolution pdf files when we save to our computer. I was able to put my printer in “poster” mode and print an enlarged 2×2 or 3×3 version of the world map with no degradation. A little trimming and Scotch tape and I had a huge map for the wall. Great feature!
Awesome! Thank you so much for this contribution to the ham radio community!!
I am having great dificulty in opening the program – it will not open in PDF
How do i open it ???
After you hit the “Create Map” button, the web server should send a PDF to your computer. This PDF should be readable with any PDF reader such as Adobe’s PDF reader.
Please reply to email address
Im having trouble downloading your map
what program will open your file ???
Kerry
Thanks for making us nice system available.
For better practicality, please display the grid locator of the location, somewhere in the remaining area; below or above the map.
It prints the latitude/longitude in the title area, doesn’t it?
Nice programme. Worked as axpected. Would like to size the map to use it on my Yaesu 2800 DXC Rotor control unit.
73
Jan
PA4JJ
My call sign is VK1MWI. I am from Canberra. Can any one make or help me to make Azimuthal map for my station ?