
This all started when I was interested in calculating the distance and bearing between amateur radio stations. I found this reference on calculating the great circle distance and bearing. Ultimately, this interest led to a web form for producing azimuthal maps.
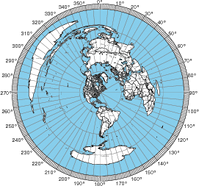
For those who never heard of an azimuthal map, it is a special kind of map that prioritizes correctly showing the great circle distance and bearing from the center reference point. Azimuthal maps are particularly useful for ham radio operators with a directional antenna. For example, if you’re in Connecticut and you want to talk with someone in Cameroon (Africa), the azimuthal map will tell you to point your antenna to a bearing of 90° on a compass (technically you also must adjust for the difference between magnetic north and true north).
It occurred to me that this the bearing and distance calculation was the fundamental tool for making an azimuthal projection. All I needed was a database of land and political boundaries expressed in latitude/longitude pairs.
The azimuthal project is always made from a particular reference point on the globe, and I can convert the points in the land and political boundary database into bearing and distance using the great circle calculations. This gives me a collection of points in polar coordinates (r, Θ) which is what I need for the azimuthal projection.
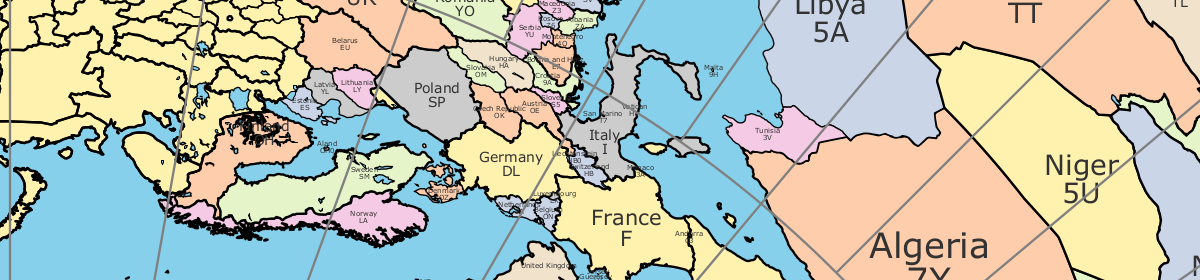
For the land and political boundary information, I used the database from the CIA World Databank II; however, it required some massaging. First it was too detailed, and I had to filter the data to an appropriate resolution. Next, I wanted land masses and water bodies to be represented by closed paths. The CIA World Databank II is a collection of unconnected paths, so I had to write a program to patch them together and reorder the points to be clockwise. Having closed paths of points ordered in clockwise orders is necessary to have water and land colored differently. Lastly, I had to identify which closed paths represent land and which represent water. Unfortunately, this work is incomplete. You’ll notice some lakes that aren’t colored blue.
Initially, my Ruby program was generating raw PostScript. However, I recognized that it would be easier for people to use if it generated a PDF. Rather than using a Postscript to PDF convertor, I changed to generating PDFs directly using the Ruby PDF::Writer. By using PostScript or PDF, I get vector graphic output that is scalable from small to very large sizes without having to make a huge raster graphic files. There is a limit to the resolution of the continent & political outline data, so at very large sizes, the outlines may not appear smooth.
Ultimately, I used the great circle distance formula from Wikipedia. According the article, it’s accurate for both long and short distances.
The hardest part of the whole project was getting the water blue. There are still some maps where the program gets it wrong, and you’ll see weird coloring. Things tend to go wrong when the reference point is inside a particular small region of land or water. In these cases, the floating point accuracy seems to cause the colors approach to fail.
My plans for future improvements include:
- add small tables of bearing & distance for important world cities around the margins
- add US and world cities to the map (particularly for area map)
- adjusting political boundaries and labels to be more accurate
- adding more views to allow people to report lakes that aren’t colored correctly
Internal Server Error
Tried to calculate then hopefully print out this map. Wasn’t going to happen:
The server encountered an internal error or misconfiguration and was unable to complete your request.
==========================================================
“Please contact the server administrator at webmaster@localhost to inform them of the time this error occurred, and the actions you performed just before this error.
More information about this error may be available in the server error log.
Apache/2.4.25 (Debian) Server at ns6t.net Port 443”
If you email me a screenshot of the information you entered, I may be able to help.
I got the same error. I think the problem is the distance. The help text says the distance is in KM but it doesn’t say units are required. I entered Atlanta as the city and 900 as the distance, all else defaults and I received the error. On a whim, I changed my distance entry to 900 km and it worked. Try that.
KJ4QMI
Well im disappointed, while the map seems to show every state of the US (i would want to see the us as one piece the same way it is with other states) some other nations like Azerbaijan aren’t shown.
I agree that the tool is limited. I have a newer tool that has a better database of country outlines. I haven’t had the time to make it web ready.
Is it possible to overlay the maidenhead system on a specific great circle map please?
I think this is what you get if you select “Lat/Long grid” and “Label grids”.
Dear Tom,
thanks a lot for providing this tool!
I’m a SWL from Germany and i own a loop antenna, your map is just what i’ve been looking for.
Knd Regards,
Rainer
Is there an easy way to remove the radials and equidistant circle from the center of the map ? I want fourth grade students to compare azimuthal “daylight” on a hemisphere (distance = 10007) with daylight on the cylindrical projection that is used on dayandnight.com. The radials and circles can be a distraction for little kids.
Sorry, I have too many other pressing things going on.
Excellent, quick! Great job! Your efforts to develop this custom mapping tool are much appreciated.
I put the map creater into homepage. I hope, you allow me this? See lower end of my German page.
http://www.hpmayr.de/Funk/index.html
But on the European Card, United Kingdom and some others are not colored.
See also the English page.
73s and thanks!
Peter dj4xn
Thanks for making a link to my map page on your site.
Hi Tom,
Thank you the opportunity of azimuth map on my QTH.
73 es DX! Sanyi HA7VK
Hello,
Great tool, I accidentally came across it while searching for an AE map centered over the N pole that can have plotted coordinates pinpoints.
Do you have any plans to add something like this to your site? Alternatively, do you know of one?
Thanks for making this and taking the time to read comments.
Chris
Internal Server Error
Tried to calculate then hopefully print out this map. Wasn’t going to happen:
The server encountered an internal error or misconfiguration and was unable to complete your request.
==========================================================
“Please contact the server administrator at webmaster@localhost to inform them of the time this error occurred, and the actions you performed just before this error.
More information about this error may be available in the server error log.
Apache/2.4.25 (Debian) Server at ns6t.net Port 443
The map generator keeps changing my coordinates by a fair amount from 47.225, -122.4030 to 47.133,-122.4010 which is far enough away to mess up pointing directions. Am I doing something wrong?
Thank you for this azimuthal map generator. The maps are beautiful!
I would like to add dots representing the locations of the stations with which I have made a QSO. I have a QuattroPro spreadsheet that converts the longitude and latitude coordinates of the stations (from qth provided by the ham, or qrz.com or other web sites) into accurate distances and azimuth. The results are somewhat different from qrz.com’s results, by I am quite confident in my math. From there, I could manually place the dots on the azimuthal map centered on my station. I have no idea how I could make this process automatic.
Thank you again, 73, Fred F5OYE
I don’t have anything to simplify this procedure.
Fiji is not displaying correctly from my home location in NZL.
Hi, when centered on Rarotonga and set to a distance of 15000, the blue
colouring of the ocean is giving odd results. Changing this to 10000 it seems to be okay.
Could there be a log or perhaps cosine distance scale? The directions would remain the same, but it would allow both near and far countries to appear on a single map? The near ones bigger and the far ones squashed up?
Worth a try?
This. Is. Awsome.
…and exactly what I was looking for. I now have local, US, and world quick references. Great job!
Tom W4XF
Generated a peculiar error trying to get Yellowstone Lake as the circumference of “the Flat Earth map” as a joke. Lake got drawn on top of continents, creating vast blue area with lightning-strike zig-zag across centre of image.
Easiest work-around in my case: make Old Faithful the edge of the world instead.
Is it possible to plot 4 digit grid squares? I’ve clicked Grid Line, but it appears its only 2 digit grid. I would like to generate maps for use in VHF/UHF contests out to 1000 km from my QTH and having this feature would be very useful.
73 & thanks for this service !
andyz – K1RA
https://k1ra.us/
Hello- I was referred to your website to create an azimuthal map. I am not computer literate nor know how to create this map. I have the latitude and longitude but the map isn’t showing the states on my map.
Do you create azimuthal maps for a fee if we provide the information to you?
Thank you for taking the time to read this.
The labeling routine appears not to be working at all. Not the lat/long, not labeling cities/countries, not the US states. I haven’t used this tool for quite a while now, but the last time I used it the labeling functions were working correctly. Any ideas for me to try?
I know you’re busy and may not be keeping the code up to date; thanks in advance for any ideas. Thanks also for providing this tool for us to use.
Chuck, K9PLX
Thanks for doing the hard work to make this tool available, Tom.
I’ve found it hugely useful.
Vy 73,
Steve – W0AZ
Hello, an excellent piece of work. Q: if I do a polar projection (origin 90,90) with radius (10000), the longitude lines end up with the prime meridian labelled “270” and Central America at the top. Is there a way to “rotate the coordinates ” so that Longitude 0 can align with Greenwich? Thanks in advance!
–Jerry
Is there a way to print a map without any lines except for the political boundaries ?
Thank you
Hello
Interresting result but i have 2 remarks :
– the letters used to name the countries are too high and they overload the others countries
– it’s a pity to don’t have the distances in kms indicated near the distance circles
if you want i can send you a azimutal map with these 2 remarks used
I can’t remember where i had generated it?
Best regards
Input relevant info press create then press download then nothing no download 🙁
EDINBURGH,SCOTLAND
The database of named places is small. I would suggest entering latitude/longitude or Maidenhead gridpoint. For example, put 55.947682,-3.2199424 for the location.
Hi Tom,
Saw your site today and used it to generate maps centered at my QTH (Chennai, India) and
instantly liked it! Thanks for making this available. One small suggestion for improvement. Is it possible to overlay different antenna radiation patterns over this map..? It would be great to have such a map printed and kept in the shack!
Thanks once again.
73 De Clement.
The program is on github.com, and someone else could add that capability. 🙂
Hi Tom,
This great work that you’ve done.
I ended up here for basically the same reason that Clement left the comment, the desire to overlay the beam angle of the antenna on an Azimuthal map. At this point I’ve downloaded the source code from GitHub and my plan is to update the code to include this feature.
So one question, is the source of the better / newer database something you can share? My e-Mail address is current on qrz.com.
73,
Roger, NK1I
Hi,
Thank you for great work, I appreciate it very much. I have only two question: why do you use Soviet Union, one Korea and other outdated borders on map? When do you plan update this?
The dataset I use for the country boundaries is based on a CIA database from the 80s, I think. https://www.evl.uic.edu/pape/data/WDB/
I have access to a better database, and I have a program that can make maps from it. I haven’t had time to make it a web tool.
73, Tom
It shows some weird parasitic lines when I enter “35.57845,-5.36837” location.. Still, a very great tool though. This also respond to the retarded flatters who think that the azimuthal map with the north pole at the center in the flat earth’s map.
I run Logger32, and they have a Azimuthal Map for DX spots, but exactly what I want. Looking for a digital one that I can run on a Raspberry Pi, that shows DX spots, shows my current beam heading. Then I can work stations that are within or close to my half power beamwidth… to be more efficient. Then I found your website, it is not exactly what I was looking for at the moment, but definitely something I have wanted for some time. Downloaded one to have printed out, and laminated.
Thank you for sharing your project and making it free to everyone. Also, thankyou for sharing how you did it. Would you consider posting your code to GitHub?
Thanks,
Johnny
Great progrma
Would it be possible at all to add an option to make an equal area map rather than an equidistant map? As far as I can tell, nobody else offers this, so anyone looking for this kind of map would be led to you.
Thanks.
Zach, I would suggest you try out https://www.giss.nasa.gov/tools/gprojector/download/
I ran your azimuthal projection application using my Galaxy S9 plus Android cell phone and it worked the first time but after that it refused to do anything.
I don’t have an azimuthal projection application. I have a website. Not sure what to suggest.
Have you ever considered offering a larger print option than 11×17? With The UPS Store and FedEx Stores offering inexpensive large format roll printing (24″ wide) it would be very nice to be able to print a wall size map 24″ square for framing.
Thanks for the service!
Craig W9CLA
The website already supports paper sizes larger than 11×17. The European 4A0 size is 5.518 feet by 7.802 feet. I basically defined paper sizes for all the standardized paper sizes I could find. If you can show me additional standard paper size definitions, I can add them.
73 de Tom NS6T
What a great tool. I however am messing somthing up and keep getting errors like this…
The data in the form contained errors in the following fields:
[“PAPER\nPaper argument is wrong ”\n”, “TITLE\nTitle has illegal characters.\n”]
Please try again.
Tom NS6T,
The last time I explored your “Azimuthal Map” was in April of 2012.
This evening I blundered into an old map that I made back then, and I noted that my Lat & Lon was not correct… so… I created a new, corrected map.
These days… as I do CAD drawings for my contractor buds, I just happen to have an HP DesignJet 1500 PS, wide carriage printer in my shop.
Wow!!! I printed out copies of your “Azimuthal Map” in Arch C ( 18″ x 24″), Arch D (24″ x 36″) & Arch E (36″ x 48″)… and I just wish I had an empty wall big enough to put one of these big prints on the wall of my shack… they were really crisp, and I got nice results on my very first try.
One little itty bitty problem… As I increased the printout from C, to D, to E, the leading (spacing between lines of text) creates a bit of a problem in the Arch D sized print. The bottom of the upper case “T” crashes into the “0°” at the very top of the map. I wonder if there an easy fix????
I poked around the HTML code of the Google browser display, hoping to find a line of code ripe for a quick fix (hack), but… as that is not my area of expertise, it would take me forever to blindly explore all the lines of code in the display.
If you wish… I could mail you some printouts so you can see exactly what I am talking about.
Mike W2MJZ
Thanks, Tom.
I’m back for another dose.
Steve W5ZA
thank you…..
jimmypatch (KD2TOJ)
Hello and thank you for this fantastic tool.
I do not know if this has already been reported, but for certain distances, the background is partially reversed. The seas and oceans are white, some countries are blue and others are white as expected, for the following distances, from my location: 2000 km 3000km
The background map is correct for the following distances:
1000 km 2500 km 4000 km 5000 km 10000 km 15000 km 20000 km
I can send you screenshots, or PDF files, if you wish.
73’s de Pat ON7ET
Hi NS6T, i am trying to create map with
-6.6385394 S, 106.7872622 E this coordinates. But it dosent accept S E coordinates and generating map with N E dosent accept – coordinates. Could you pl help. Viv Jos
Thanks for the really great map generation tool – it’s Fantastic!
Very useful, excellent site, many thanks for all your work.
I have enjoyed your map and have a few around the shack. Now that I have a rotor and use RstRotator to beam the antenna a jpg map output would be muchly appreciated
Dear Tom,
very nice tool! thanks for sharing.
When playing around with it I found, what I think is an funny anomaly.
The “blue background” settings reversed when I made maps with a distance between 1493km and 3134km. Outside this range, so from 1492km and closer and from 3135km and further away, the representation of bodies of water was correct.
The parameters I used were: Location: 50.2254695, 6.3804358 ; Paper: A4 ; B&W: on ; Lat/Long: on ; Label g: off ; Label co: off ; Label NA: off ; Label ci: off ; Blue B: on ; View in b: on.
If you want the corresponding map results and a screen shot from the settings, please let me know via mail. I will send them to you.
Many 73
de PA11392
Internal Server Error
The server encountered an internal error or misconfiguration and was unable to complete your request.
Great tool. I assume the bearings are degrees true. It would be helpful if that was marked on the map. And is should not be difficult to include the magnetic variation for each location, or give the user an option. Thanks!
outstanding and useful site. Thanks very much!!!
Tom N7ESE
I think you’ve done a splendid job in providing this service. I read about it in RadCom July 2020 and I’ve now printed several scales to A3 photo paper. I look forward to seeing other places where where hams live and play, such as The Balearic Islands, The Canary Islands, Malta, Cyprus and so on.
Michael EA7KIR.
Dear Tom,
I am a high school science teacher and my husband is K1SDC. He introduced me to your maps and I am requesting your permission to publish our house centered map in an article I am writing for the Bridgton News, our hometown paper. I am not being paid…..community service article that compares maps with globes.
Thanks,
Lega Medcalf
Bridgton, Maine
Great tool to make the shack more beautiful.
Thank you for making it available. Congratulations on the work! 73 de PY2NL.
Wonderful map! Is there a way to rotate the presentation by an arbitrary angle?
Lots of fun, thanks, Tom!