
This all started when I was interested in calculating the distance and bearing between amateur radio stations. I found this reference on calculating the great circle distance and bearing. Ultimately, this interest led to a web form for producing azimuthal maps.
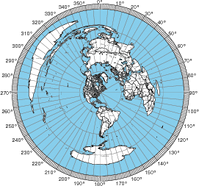
For those who never heard of an azimuthal map, it is a special kind of map that prioritizes correctly showing the great circle distance and bearing from the center reference point. Azimuthal maps are particularly useful for ham radio operators with a directional antenna. For example, if you’re in Connecticut and you want to talk with someone in Cameroon (Africa), the azimuthal map will tell you to point your antenna to a bearing of 90° on a compass (technically you also must adjust for the difference between magnetic north and true north).
It occurred to me that this the bearing and distance calculation was the fundamental tool for making an azimuthal projection. All I needed was a database of land and political boundaries expressed in latitude/longitude pairs.
The azimuthal project is always made from a particular reference point on the globe, and I can convert the points in the land and political boundary database into bearing and distance using the great circle calculations. This gives me a collection of points in polar coordinates (r, Θ) which is what I need for the azimuthal projection.
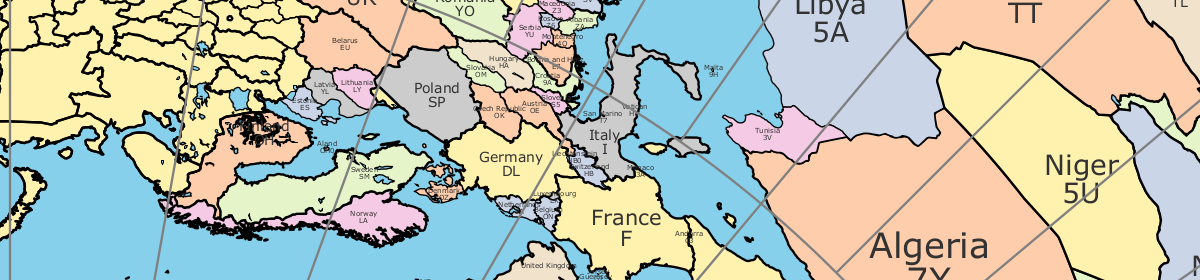
For the land and political boundary information, I used the database from the CIA World Databank II; however, it required some massaging. First it was too detailed, and I had to filter the data to an appropriate resolution. Next, I wanted land masses and water bodies to be represented by closed paths. The CIA World Databank II is a collection of unconnected paths, so I had to write a program to patch them together and reorder the points to be clockwise. Having closed paths of points ordered in clockwise orders is necessary to have water and land colored differently. Lastly, I had to identify which closed paths represent land and which represent water. Unfortunately, this work is incomplete. You’ll notice some lakes that aren’t colored blue.
Initially, my Ruby program was generating raw PostScript. However, I recognized that it would be easier for people to use if it generated a PDF. Rather than using a Postscript to PDF convertor, I changed to generating PDFs directly using the Ruby PDF::Writer. By using PostScript or PDF, I get vector graphic output that is scalable from small to very large sizes without having to make a huge raster graphic files. There is a limit to the resolution of the continent & political outline data, so at very large sizes, the outlines may not appear smooth.
Ultimately, I used the great circle distance formula from Wikipedia. According the article, it’s accurate for both long and short distances.
The hardest part of the whole project was getting the water blue. There are still some maps where the program gets it wrong, and you’ll see weird coloring. Things tend to go wrong when the reference point is inside a particular small region of land or water. In these cases, the floating point accuracy seems to cause the colors approach to fail.
My plans for future improvements include:
- add small tables of bearing & distance for important world cities around the margins
- add US and world cities to the map (particularly for area map)
- adjusting political boundaries and labels to be more accurate
- adding more views to allow people to report lakes that aren’t colored correctly
Is it possible to ADD the Grey Line at a used specified UTC time on a user specified day and month?
Possible but not easy. I have an interactive program that does this, but it’s not really ready for production.
Could not ind a donabutton
Hello NS6T, I am afraid the azimuth page does not seem to work.
Thank you for your work!
Best regards,
PA3L
It’s working for me. Let me know the particulars of your request.
Internal Server Error
The server encountered an internal error or misconfiguration and was unable to complete your request.
Please contact the server administrator at webmaster@localhost to inform them of the time this error occurred, and the actions you performed just before this error.
More information about this error may be available in the server error log.
Apache/2.4.52 (Debian) Server at ns6t.net Port 443
Hoping to make a map centered on my location, but apparently your server cannot be found… It is 1/3/2021
I think it’s back.
Hi Tom…
I tried several times using this string: 33° 41′ 14″ N, 117° 49′ 33″ W
Kept getting “Internal Server Error”. Also tried different sizes, with the same result.
Thanks for providing such a nice service.
Jon KA6MOK
Use 33.687222, -117.825833 instead.
Ah, that works. I guess you can’t use N/S or E/W to indicate + or – anymore? Good to see it’s working otherwise.
Thanks again!
Oops.. re read the instructions, and it was probably my formatting, the page won’t parse the degree, minute, second characters. right? Anyway, yet another lesson in RTFM… 😉
This is an excellent resource! Something I wish it had was an option to fill in Maidenhead grid squares with either two or four places (e.g. CM or CM86, depending on map resolution)
Thank you for this! I needed to calculate the angle between two locations when drawn on a polar azimuthal equidistant map, and your tool allowed me to calculate it real easy.
One question: would you have similar software for maps in other polar azimuthal projections like stereographic and gnomonic?
Sorry, I don’t have any other polar azimuthal projects.
Tom NS6T
HI,
can You add the equator line the see the part of the other hemisphere and choose it with a flag ?
Anyway great app.
73 de ik8udd, Ermanno
This could be done. I don’t have any plans to do it.
Hi,
Many thanks for this great tool.
If I understood it correctly , here is the place to report bugs etc 🙂
I have a remark/bug and a little wish 🙂
Remark:
When I generate a map with for example 1500km from JN39 I have all continental Europes countrys in blue and the U.K. & Ireland in white. So it takes in count Brexit 😉
little wish: Ability to generate Great circle maps with 4 char locators written on it for VHF / UHF work 🙂
Many thanks
Regards
Felix
I never found a bullet proof way to see if the center was enclosed in land or not. In most cases, I was able to fix the blue by using a nearby location or different distance. You can also turn off the blue.
Hi Tom,
I really enjoy using your Azimuthal maps and find it helpful. I was wondering for a future feature if you could plot “real time” MUF as seen at https://prop.kc2g.com/ but overlaid onto the Azimuthal data for a selected location. It would let you see in real time if propagation is likely open between the selected location and any place in the world easily.
Thanks again!
NT6H
Bug report: When I use the parameter: Center: 22°18’0″N 114°0’0″E Radius: 10000 km to generate the map, the part from France to Greenland become bugged with national and land boundary broken.
In addition to the previous reported problem, Fiji is also bugged in multiple map different maps that show it, including the map of Center: 22°18’0″N 114°0’0″E Radius: 10000 km
Yes, bad things happen when there is a small island on the other side of the world from the center. Small islands are defined by very few points, and some of the approximate methods used in the map generation fail. You can often resolve the problem by moving your center a little.
I think the problem with Fiji is not merely because of small island. Instead, it seems to me there are some islands near Fiji that crosses the 180 degree longitude, and isn’t handled correctly, causing and abnormal white quadishape around the area.
In addition, there are problem with map data, like the map didn’t show the name of Hong Kong when click showing city name, but instead show “Xianggangdao”, and it displayed “Macao, China” as country name instead, while it didn’t display the name of Taiwan, and for the Taiwan city of Taipei and Kaohsiung, it also spelled their name as Taibei and Gaosyong using less common way of transliteration
The map have also missed the boundary between Koreas and the boundary between Russia and Kazakhstan, Ukraine, Belarus, Baltic countries, Greogia, Armenia, and Azerbaijan, as well as border between Israel, Jordan, Lebanon, Egypt. The map also missed border between Saudi Arabia, UAE, Oman, Yemen, and Bahrain, with Yemen’s label also disappeared. Border between Somalia and Ethiopia is also partially missing. And there is a strange gap between the border of Iraq and Saudi Arabia, near Kuwait.
The map also missed the label for “Pyongyang” and other North Korean cities, with Nampo being name of the only one being shown. The map also missed any city in Laos.
The map labelled Northern Mariana but missed Guam. It also shortened the name of Federation of Micronesia into Micronesia which IMO shouldn’t happen because Micronesia is also the name of the bigger region it’s in.
It displayed Australian capital as “Canberra-Queanbeyan (ACT-NSW)” which I am not sure what it mean. The map also missed New Zealand capital.
South Sudan is missing from the map together with their cities.
National label for Singapore is also missing.
Anchorage in Alaska is being shown as “Anchorage municipality which is quite redundant.
The sources used for land and country borders are old. It has many flaws are you point out.
I have a new program based on another more recent database, but I haven’t had time to make it robust enough for deployment via WWW.
The political and land boundaries come from this database: https://www.evl.uic.edu/pape/data/WDB/. https://www.naturalearthdata.com/ has better data, and I have a C program that generates maps using it. It’s not bullet proof enough for deployment on the web.
Is there a reasonable way to get these in a decently crisp .jpg instead of .pdf? I’ve got a piece of an idea and that seems to fi along side.
Load PDF in Inkscape, use the export PNG feature to make a PNG bitmap at the desired resolution. The GIMP, can convert the PNG into a JPEG if that’s desired. On Linux, there are lots of other tools that can convert a PDF to JPEG.
Feature Request: It would be nice, if instead of generating the map on a single A0/A2/A4 paper, it can also generate the map and cut it up into 2×2/3×3/4×4 pieces of A4 paper in the PDF, with an additional index page showing their order.
Another feature request: Add blue marble satellite photo, or topographical map, as optional map layer to the generation product, similar to gcmap dot com’s option
41.3172684, -5.2137560, 20015
New Zealand apparently doesn’t like being round the outside?
Yes, the resolution of the outlines are relatively coarse, so it looks bad when an island is around the outside.
Hi Tom,
this is a great, very useful tool. I generated a map for VHF/UHF contest use around my locator using radius 1.200 or 1.600km. Would it be possible, not to have only Maidenhead greater fields but also squares (00..99) ? E.g. with thin red lines and numbers ?
I would really apriciate such a feature.
vy 73 de Rolf
If you would like to edit the program to add this capability, I can give you access to the code and provide the outline data.
How do I send you an azimuthal map that shows the center of a circle that just touches 3 extreme points on the coasts of the Lower 48, the smallest circle that surrounds all territory of the Lower 48?
I keep getting a “500 Internal Server Error” when attempting to create a map. I attempted with both a city and state and the actual latitude and longitude.
Your fellow amateur radio buff Geoff Fox posted a link to your Azimuthal Projections map web site, so I guessing you have had a multiude of requests.
I will bookmark the site and try later
hi not sure if im doing something wrong or the map is doing something wrong LOL. I type in cords, distance, etc click show city labels, submit the map and it gives me grids and towns but its all blue. No map or anything else shows up. Is that right? in a video I watched of LCARA Ham Radio they had lakes and roads and more on their map.
What am I doing wrong?
There are some heuristics (approximate methods) to determine which side of the graph is inside the shape (land) and outside the shape (water). Sometimes, this goes horribly wrong, and land and water are inverted or just blue everywhere. Sometimes you can get something better by turning off the water fill (deselecting blue background).
im not seeing the actual map just blue. I do see the cities names but no map. any help is much appreciated.
There are some heuristics (approximate methods) to determine which side of the graph is inside the shape (land) and outside the shape (water). Sometimes, this goes horribly wrong, and land and water are inverted or just blue everywhere. Sometimes you can get something better by turning off the water fill (deselecting blue background).
How can I download it so that the texts and the lines will be layers instead of just an image on a PDF?
Like I want to open it in GIMP with everything as a layer so I can turn it off and on as needed
I understand what you’re asking for having used GIMP myself, but I don’t believe it’s achievable without a lot of programming work. If you want to do the programming work, I can make the source code and data files available to you.
I think Inkscape is a better tool to use on the PDF because Inkscape knows how to read scalable vector graphic file formats. You may be able to do some of the post processing you want without any changes by me.
Hi! I love this map tool, but I’m running into a problem. If I center on the North Pol (90N 0W) and render the maximum distance, the heading degrees are messed up. For example, New Zealand is rendering at the top of the map, heading 0 degrees.
This is entirely wrong as compared to, say, Gleason’s map or even just historical land claims in Antarctica. For example, New Zealand historically claims the Ross Dependency (150 degrees west to 160 degrees east). This would be on the OTHER side of Antarctica from New Zealand according to your headings.
Maybe I’m missing something (reawakened an interest in geography in my old age, haha) but it seems to me like your headings are inverted from top to bottom in my end result projection.
Anyways, I’d be very appreciative of some insights or thoughts. I’m wondering if I incorrectly formatted my input or missed some means of offsetting/inverting the headings. I can make this work for my uses, but it means I’ll have to overwrite all the headings by hand.
This reminds me of an old puzzle. You’re in a hut with all southern views. You look out the window and see a bear. What color is the bear?
An azimuthal map from the north pole is basically undefined. If you’re at the north pole, every direction you look is south (a bearing of 180 degrees). In some respects, I suppose the map should collapse into a line where everything is at bearing 180.
Navigations or map specialists may have a way to handle this, but it’s beyond me. If you’re planning a trip near the poles, I suggest working some somebody with more expertise than me.
First off, this is a great tool! Thank you for building it. Unfortunately, some islands and bodies of water are colored inconsistently.
For example, this request:
Grid location: CN87uo
Distance: 1000
The various islands (Vancouver Island, the San Juan islands, etc.) are white instead of blue. Some major bodies of water are white (in northern California) but most are blue (in British Columbia, Washington, Idaho, Montana, etc.).
Yeah, the method to determine what the inside of the land isn’t perfect. You can turn off the blue water to get something more reasonable.
Awesome work! I haven’t noticed problems from the several locations that I’ve used as center. I have two suggestions that should be easy to implement.
– an option to add tropics, polar circles, poles and equator (independently from lat/long grid)
– an option to have no political borders at all. A clean map of only landmass and water.
Glad that it has worked well for you. Thanks for your suggestions. I have no idea if I’ll ever get around to implementing them.
Thanks for Map! Worked for me ok .
Great tool but the map and the country boundaries are a bit too old. Like 30 years or so. 🙁 Yugoslavia does not exist since 1991!
You’ve very right. I have better database and a better program, but it’s not ready for web deployment.
Two comments:
First, in your first paragraph from this page (https://ns6t.net/word/?page_id=10), you state, “technically you also much adjust for the difference between magnetic north and true north”. “Much” should be “must.”
Second, a world map on an 8.5″x 11″ paper is rather small. Is it possible to make an option to print portions of the map on each of several sheets, to be pasted together after printing into a larger map?
Thank you so much find reporting the typo! I believe there are some tools to print large PDFs using multiple pages using “tiling”.
Is there an azimuthal map for local contacts? When I zoom in to a 100km radius the terrain detail is very low. I’m looking for a VHF/UHF friendly map and Radio Mobile doesn’t let me use more radials on its maps. Thank you.
The program with more map details doesn’t zoom in. Sorry.
Hello there! Good job on the website, do we have an ETA for the new program you’ve been talking about thats not yet ready for web development?
Sorry no ETA. It’s not a priority for me.
Hello, I am trying to create a map with more precise location info that I did previously. But all I get is an error message as follows:
Internal Server Error
The server encountered an internal error or misconfiguration and was unable to complete your request.
Please contact the server administrator at webmaster@localhost to inform them of the time this error occurred, and the actions you performed just before this error.
More information about this error may be available in the server error log.
Apache/2.4.38 (Debian) Server at ns6t.net Port 443
Can you help?
Thanks
-david BTW
A location of “40.6552943, -111.9174729” will work. If all else fails use decimal latitude comma decimal longitude.
Hey Tom,
Just dropping by to say hello and a long time no see. Hope all is well.
As always thanks for the very useful tool!
Eric
de AK6Y (formerly KE6MRG)
Nice program. It provides a sufficiently detailed map to orient a beam antenna.
Since I live near San Diego, the magnetic declination is 12 degrees from true north. Is it possible to create a map with this correction built in? I can do the mental math, usually, but it would be nice to have a map based on magnetic north for my location.
I have a Suunto compass where you can dial in the magnetic declination change, and then for that location, north is true north.
very nice tool !
Thinking out load , would it be possible to generate “realtime” azimuth plots for whatever locations with greyzone line in it.
kind regards,
Frank
de pa3gcj
I wrote a prototype of such a program, and I showed to a friend in the NCCC. He said it needed a bunch more functionality from other ham map programs to be useful, so I dropped the project.
I’m trying to get the map at Crozet Island (51 00E, 46 25S)
My request is blocked by Internal Server Error. My mistake ?
I think if you put the location as -46.255, 51.0 it should work.
The state boundaries of the USA and Canada should be optional (as well as those of Australia, Brazil and all other countries for which there are data for provinces, states, districts, etc.)
Too many options will make the user interface unwieldy.
How about an interactive generation of oblique conical maps? That would be cool! (and you could get cylindrical maps with little extra ‘cost’. (just don’t divide or multiply by infinity!)
How would such a map be useful to ham radio operators? I work on maps for the sake of ham radio. I am not into maps for maps sake.
Works great on MS Edge as of 30/11/2021!
Fantastic work, kudos to NS6T
Great utility, really appreciate it!
I am a map freak and this is a bonus to my amateur radio operation interests.
Scott W9DRF
Hi, Running Firefox 94.0 (64-bit, Ubuntu 20.04) , and am getting the following:
Internal Server Error
The server encountered an internal error or misconfiguration and was unable to complete your request.
Please contact the server administrator at webmaster@localhost to inform them of the time this error occurred, and the actions you performed just before this error.
More information about this error may be available in the server error log.
Apache/2.4.51 (Debian) Server at ns6t.net Port 443
—
I’ve used the generator before, and have never had a problem with it.
73, Jim KK0U
A system upgrade broke everything, but it should be fixed now.
Hi my friend. Thanks for you project!.
But i have a problem :
Internal Server Error
The server encountered an internal error or misconfiguration and was unable to complete your request.
Please contact the server administrator at webmaster@localhost to inform them of the time this error occurred, and the actions you performed just before this error.
More information about this error may be available in the server error log.
Apache/2.4.51 (Debian) Server at ns6t.net Port 443
I cannot create my map. Please help me.
Thanks
A system upgrade broke everything, but it should be fixed now.
The map is not working for (46.8954240, -122.4537428).
For some reason its not pulling up on my phone. Anyone you could please pull on up for me? 30km distance.
Thanks!!
A site upgrade broke it for every location. I just fixed it now. Please let me know if it’s still not working for you.
Hi,
I have a paid for azimuthal map app, but still I come here for the zoom capability to enable me to get headings for portable VHF operations.
Thank you for a great, FREE tool, really appreciate the effort that has gone into this.
I’ll be using some large scale plots for our club shack when we reopen in January ’22
All the best
GM0EDJ
Thank you for great and very useful utility !
Feature request: Can you make an option to generate .svg file ?
Eduard, R8AEC
Centre:
69.48901637387958, 176.17658455494578
Radius:
333 km
Coastline takes a shortcut, leaning Leningradsky, Chukotka, out at sea, then does something really weird west of there.
I’ve tried other centres nearby, thinking it was just a glitch because a vertex was on the edge, but the issue is there in all the output maps.
Sadly, there are some glitches in the land outline database that I use. I hope to have a system with a better database sometime.
Tom
Vanua Levu, Fiji, stretched out east-west.
Centre at -16.403774882418652, 179.33799256738232
Update: this doesn’t happen with a small radius like 300 km, but does happen with a large radius like 1000 km.
Blue islands:
-23.155221660820366, -44.22920438879262
62.62470315298766, -74.18815086576818
4.45964219506998, 7.23255086591236
15.722522551409055, 40.074604535514034
16.70317098540287, 41.97250779009505
16.872917657684226, 41.90174458290081
11.521457515203736, -16.319209184158876
53.98869720938143, -10.04483552619934
69.82271373612157, 29.874406618329235
78.28264753160896, 106.50597611714689
80.79427087613102, 58.44599811810602
81.24217836883206, 56.69159358581942
81.77240690856061, 58.72035798464105
-7.874503201351569, 39.77248584153961
City in middle of sea:
48.844228087830295, 148.98824558261356
More blue islands:
-76.7810245684833, -148.60939510360993
Hello –
Map generator does not render the map. Form allows you to enter info.
Thank you for this site. This is awesome.
Hi, been using you great tool a lot, lately to beat Wordle … 😉 It always worked perfectly … until today when “Bogota” as central location led to a remarkable crash. While “Caracas” e.g. did fine.